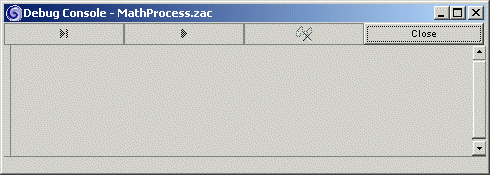
A new window, the Debug Console, appears after a few moments.
One of the most powerful features of AppComposer is that it allows you to run and test a project while you build it. If this were an application or an applet, you could use the Toybox feature to test what the project does. AppComposer also has features that let you test that your servlet does what you expect it to, and diagnose the problem if it does not.
This exercise uses the JSP MathProcess.zac capsule to look at AppComposer's debugging functions. If you have not built this capsule, you can use the MathProcess.zac capsule included in your AppComposer/examples/Math directory.

The debug console provides you with clickable debugging options and displays debugging output of interest as you play, or step through, the capsule.
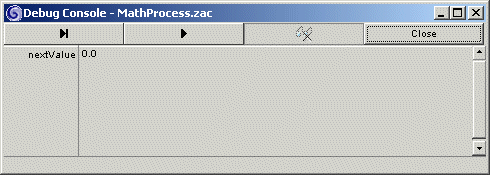
Setting a watch variable allows you to see the value of a variable as it may change throughout the execution of the program. This is particularly valuable to track the results of a certain behavior in the capsule. For instance, if you expect it to send a certain value to a variable, you can see the results at every step of the program.
As you click the step button, you can watch what effect each step of the program may have on the value in the variable. This makes it easy to track down when a particular step may not give you the results you expect.
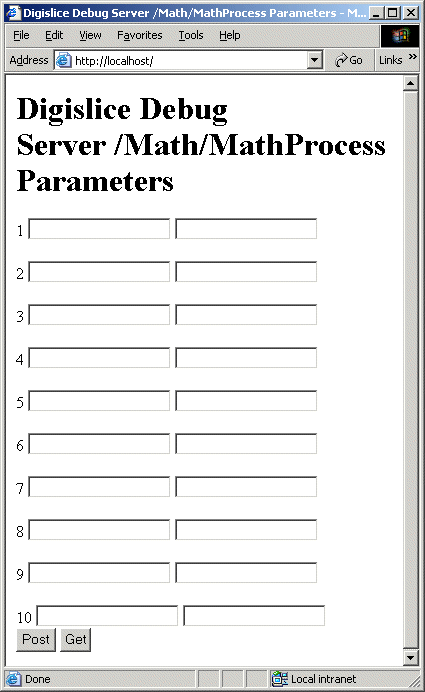
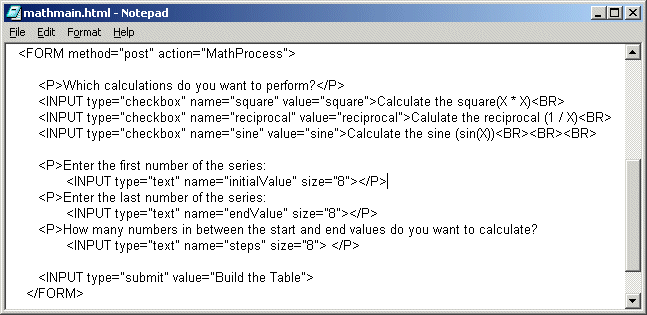
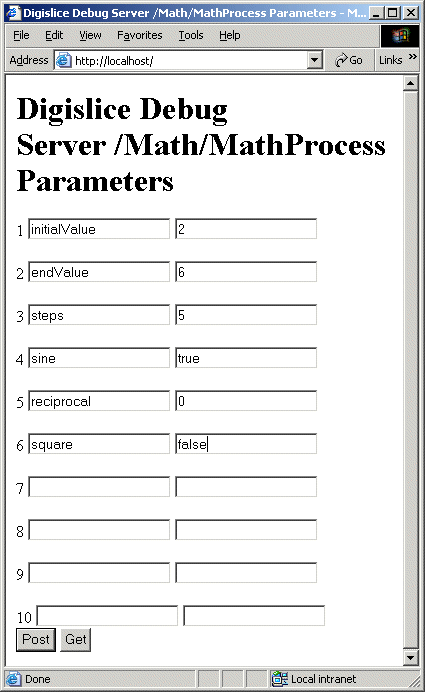
A red arrow has appeared to the left of the on output action group,
indicating that execution has stopped just before executing the on output
behavior (or on POST behavior if you are using the capsule included in
AppComposer).
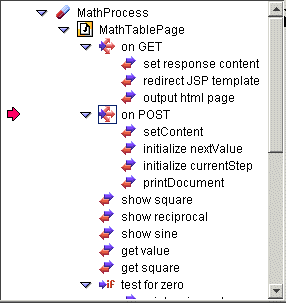
The watched variables in the Debug Console have not yet changed, because the
value of nextValue has not been set yet. However, the single step ![]() and play
and play ![]() buttons
are enabled in the debug console toolbar. In addition, a new entry has appeared
in the debug console named ACTIVATINGEVENT. This entry contains the content
of the request that invoked the servlet capsule. Click the wedge next to ACTIVATINGEVENT
and then open up its child entries to see in detail what it contains. Note the
list of parameters and their values.
buttons
are enabled in the debug console toolbar. In addition, a new entry has appeared
in the debug console named ACTIVATINGEVENT. This entry contains the content
of the request that invoked the servlet capsule. Click the wedge next to ACTIVATINGEVENT
and then open up its child entries to see in detail what it contains. Note the
list of parameters and their values.
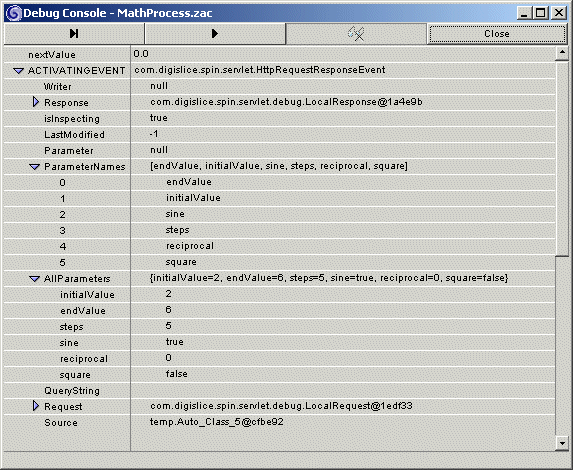
Click the single step button once to step to the setContent action, again to go to initialize nextValue, and one last time to get out of initialize nextValue. In the debug console, nextValue should now have a value of 2.0.
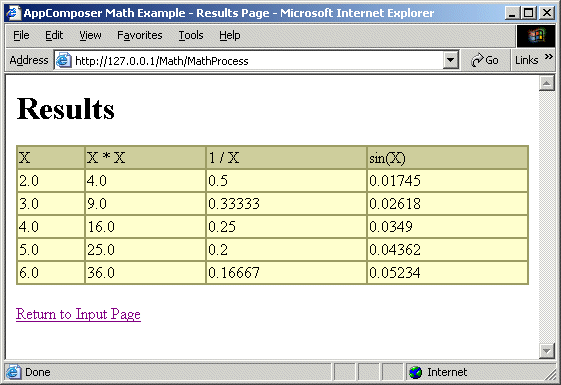
You could continue single-stepping through the capsule, but with the loops it contains, this would take a very long time. Instead, press the play button to see the results of the servlet in the browser. Your results should match the following:
Look in the DebugServer tab of the console pane to find any error messages from execution on the debug web server.
You can also remove all of the breakpoints from your capsule at once. To do so, select Clear all Breakpoints from the Capsule menu.
Those are the basics of using the AppComposer debugger. Experiment with different values and setting watch on different variables to see what happens. You can introduce a deliberate error, such as writing "two" for initialValue instead of 2. Try leaving some of the parameter values blank.
Congratulations! You have finished parts one and two of the Introductory Tutorial. AppComposer has a large feature set and introduces a new framework for building applications, so we have provided many more tutorials, reference guides, examples, and concepts overviews to help you use it to its full extent. Clicking the Next Section button below takes you back to the main tutorials page, where you can branch to lessons on using EJBs and connecting to databases with AppComposer. At any time, you can access the documentation set from AppComposer's Help menu.